SAIL’s space situational awareness project is named OSCOM, which is an Optical tracking and Spectral Characterization system designed specifically for responsive observation and analysis of CubeSats for Operational Missions. The project was seed-funded by an NSF RAPID award (#AGS-1450999). The details of the OSCOM system were published in a peer-reviewed article in the Sensors journal, titled "Multi-Site Simultaneous Time-Resolved Photometry With a Low-Cost Electro-Optics System." By interpreting the optical and spectral features of resident space objects (RSOs), OSCOM is attempting to determine several physical parameters that describe the object: spin rate, deployable status, material makeup and degradation, attitude, and more. Such information can then be used to characterize, categorize and monitor uncontrolled or unknown space objects, as well as independently provide diagnostic information for operational satellites, big or small. SAIL has multiple Celestron RASA 11-inch telescopes and one Celestron 14-inch EdgeHD with Starizona Hyperstar, and access to CDK 20-inch and DFM 1-meter telescopes through the Embry‑Riddle Observatory.
Although OSCOM specializes in small satellites and CubeSats in low Earth orbit (LEO), the project team also develops observational and analysis techniques for solving space situational awareness problems with spatially resolved satellites in LEO, satellites in GEO, and debris and near-Earth asteroids. Some of the past and present research activities of OSCOM include:
- Robust photometry, spectroscopy and orbit determination
- Spacecraft attitude determination and multi-site simultaneous observation
- Mining and heuristic analysis of large datasets
- Telescope and detector characterization and tracking system design
- Lucky/speckle imaging and deconvolution methods for high-resolution imaging
- CubeSat design and ground truth optical characterization
OSCOM is supported by a diverse team of Embry‑Riddle students and engineers whose expertise includes small satellites, systems engineering, observational astronomy, data analysis, control systems and computer science. Research efforts are led by Dr. Barjatya and Dr. von Hippel. For more details on OSCOM, check out the menu at the top of the page, or browse the SAIL@ERAU YouTube channel.
 Precision photometry of low Earth orbit (LEO) objects is difficult because of the high angular rate of these objects as they pass over the observatory site. Tracking constraints are tight and require accurate timekeeping and mechanical considerations of the telescope mount. With the absence of conventional comparison stars and the large change in airmass over the satellite’s track, standard astronomical photometry requires careful calibration for accurate results.
The video below is an example of OSCOM assets tracking small satellites (in this case: NRL’s SpinSat using an 11″ Celestron Rowe-Ackermann Schmidt Astrograph). Note the static star field for the first 10 seconds. As SpinSat comes into the field of view, the telescope starts tracking the satellite. The stars appear as streaks, whereas the satellite is a simple dot that slowly moves up/down and left/right as the telescope controls are tested. For more videos, please visit our YouTube channel.
SpinSat Tracking Test: Acquisition in Motion
Watch the moment SpinSat is acquired through a tracking scope as it moves across the night sky. This test captures how the tracking system adjusts in real time to follow the satellite’s motion.

SAIL students have created a custom photometry analysis toolset in Python that allows rapid reduction and analysis of images for photometry. Research is being conducted in robust techniques to extract accurate absolute photometry without time-consuming imaging of standard calibration star fields. As OSCOM’s light curve library grows, heuristic analysis techniques will be utilized to learn about the optical signature of different resident space objects and help identify unknown or uncontrolled objects.
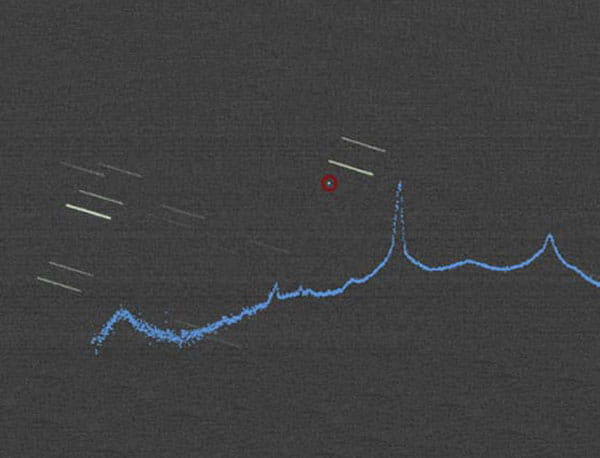
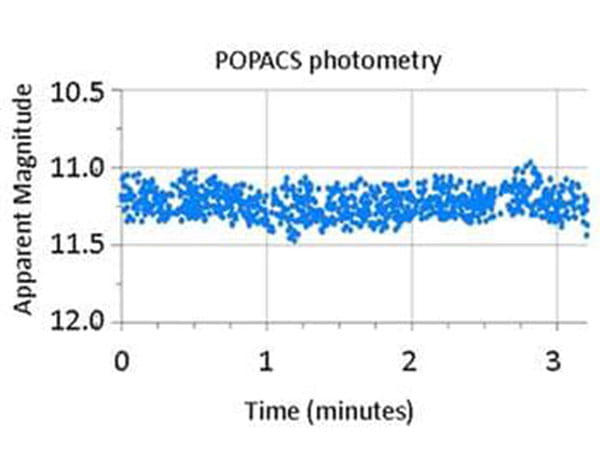 As another example of tracking of objects in LEO, the video below captures the POPACS-2 satellite using the 11″ Celestron RASA telescope. The Polar Orbiting Passive Calibration Spheres (POPACS) mission launched three 10 cm passive spheres specifically for ground-based observations. These spheres allow observatories to verify the capability to detect a CubeSat-sized object. Photometry output for POPACS is shown in the image to the right. The trend is a straight line, as would be expected of a passive sphere. However, there is a significant spread in the photometry output, presumably due to low signal-to-noise ratio. SAIL has plans to acquire a 14″ RASA in the near future, which should lead to a better SNR.
Tracking a 10 cm Satellite in Low Earth Orbit
Watch the POPACS-2 calibration sphere pass through the field of view as the tracking system follows its motion across the sky. This observation demonstrates the challenge of detecting and monitoring small, passive objects in low Earth orbit.
OSCOM is a highly portable system and can be fully deployed with an hour or two of setup time in the field. This capability enables multi-point simultaneous observations if the manpower and equipment are available. The total system cost is less than $10K and is thus feasible. The system’s capability was showcased by doing observations of Hitomi debris from two locations simultaneously. Hitomi, also known as ASTRO-H, was a Japanese X-ray astronomy satellite that experienced a catastrophic event on March 26, 2016. Shortly after, the U.S. JSpOC reported several pieces of debris from the breakup. The brightness of the main piece, peaking between magnitude 2 and 3 in the SDSS r’ band, allowed photometric measurements to be made at over 100 Hz for several passes of the satellite over the span of a month.
Shown here is an eight-second duration when Hitomi was observed simultaneously from two sites 180 miles apart to provide two different look angles at the tumbling satellite. The flight path modeled in AGI STK is shown below. The data shown here is when the satellite was towards the southeast from Daytona and towards the east-northeast of Palm Beach. Note that as the two sites have a different look angle, the overall photometry output is different, and yet the high cadence measurements show a consistent flash pattern with a primary period of about 2.6 seconds. It is conceivable that such simultaneous multi-point measurements can aid in faster attitude determination of the resident space object if its configuration and geometry were known a-priori. Further details of the effort can be found in our peer-reviewed paper in Sensors journal, "Multi-Site Simultaneous Time-Resolved Photometry With a Low-Cost Electro-Optics System."


Tracking and Characterizing Hitomi Satellite Debris
The video below is an example of OSCOM assets (11″ Celestron Rowe-Ackermann Schmidt Astrograph and Manta G-235 camera) tracking Hitomi’s debris K. For this particular pass, a full-frame capture was done. You can see stars streak by as the debris flashes periodically. The second video is for the main Hitomi body, for which a sub-frame capture from the camera was performed. As a side effect, the video below does not have any stars streaking by, but the high frame rate — over 100 fps — allows for significantly more points in photometry output.

SAIL’s space situational awareness project is named OSCOM, which is an Optical tracking and Spectral Characterization system designed specifically for responsive observation and analysis of CubeSats for Operational Missions. The project was seed-funded by an NSF RAPID award (#AGS-1450999). The details of the OSCOM system were published in a peer-reviewed article in the Sensors journal, titled "Multi-Site Simultaneous Time-Resolved Photometry With a Low-Cost Electro-Optics System." By interpreting the optical and spectral features of resident space objects (RSOs), OSCOM is attempting to determine several physical parameters that describe the object: spin rate, deployable status, material makeup and degradation, attitude, and more. Such information can then be used to characterize, categorize and monitor uncontrolled or unknown space objects, as well as independently provide diagnostic information for operational satellites, big or small. SAIL has multiple Celestron RASA 11-inch telescopes and one Celestron 14-inch EdgeHD with Starizona Hyperstar, and access to CDK 20-inch and DFM 1-meter telescopes through the Embry‑Riddle Observatory.
Although OSCOM specializes in small satellites and CubeSats in low Earth orbit (LEO), the project team also develops observational and analysis techniques for solving space situational awareness problems with spatially resolved satellites in LEO, satellites in GEO, and debris and near-Earth asteroids. Some of the past and present research activities of OSCOM include:
- Robust photometry, spectroscopy and orbit determination
- Spacecraft attitude determination and multi-site simultaneous observation
- Mining and heuristic analysis of large datasets
- Telescope and detector characterization and tracking system design
- Lucky/speckle imaging and deconvolution methods for high-resolution imaging
- CubeSat design and ground truth optical characterization
OSCOM is supported by a diverse team of Embry‑Riddle students and engineers whose expertise includes small satellites, systems engineering, observational astronomy, data analysis, control systems and computer science. Research efforts are led by Dr. Barjatya and Dr. von Hippel. For more details on OSCOM, check out the menu at the top of the page, or browse the SAIL@ERAU YouTube channel.
Tracking Geostationary Satellites with OSCOM
Watch EchoStar XII (Rainbow-1) and EchoStar XVI appear fixed in their orbital slot while the background stars drift across the field of view. This observation demonstrates how optical tracking systems monitor and characterize satellites in geostationary orbit.